Nifty Node: Investigating a performance regression
It all started when Dan Allen told me that he noticed that Antora — a documentation site generator based on Asciidoctor.js — was 40% slower on Node 12 compared to Node 10.
Dan quickly identified that Asciidoctor.convert was significantly slower.
At this point, I was really surprised because the V8 JavaScript engine, used in Node, is renowned to run faster from one version to a newer one.
Since the Asciidoctor.js repository contains a benchmark script, I was able to measure precisely how much slower Asciidoctor.js was on Node 12 compared to Node 10. For reference, the benchmark script measures how much time it takes to convert the AsciiDoc User Guide.
Without further ado, the result:
Load scripts: 0.08s
avg: 494.40
stddev: 68.72
50th: 469.50
75th: 497.50
90th: 530.80
99th: 674.98
Load scripts: 0.058s
avg: 2406.50
stddev: 72.72
50th: 2380.00
75th: 2417.75
90th: 2477.40
99th: 2585.94
On this benchmark, Node 12 is 3.8x to 5x slower compared to Node 10.
My reaction was basically 😱😱😱
Flamegraph profiling
Flamegraphs are great to discover bottlenecks and hot paths.
On the JVM, you can use the excellent async-profiler to generate flamegraphs.
While looking for a similar tool in the Node ecosystem, I found 0x.
0x can profile and generate an interactive flamegraph for a Node process with a single command, and it’s working wonders, I highly recommend it! 🎉
In this case, the goal is to generate one flamegraph when running on Node 10 and another one when running on Node 12. Hopefully, we should be able to spot differences between the two flamegraphs. We might even be able to visualize where the time is spent and which calls are slower.
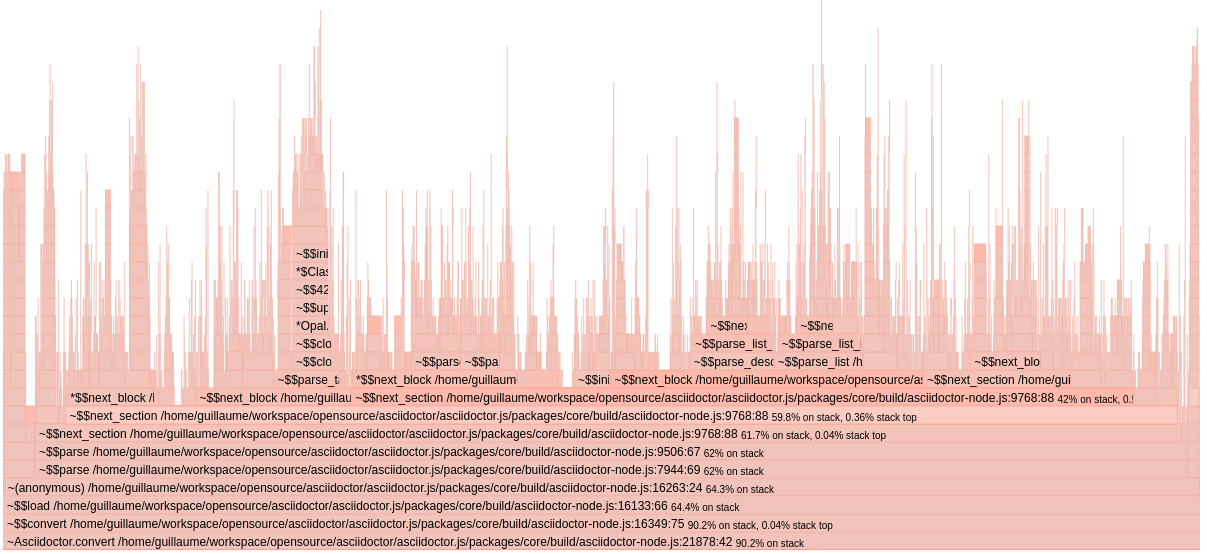
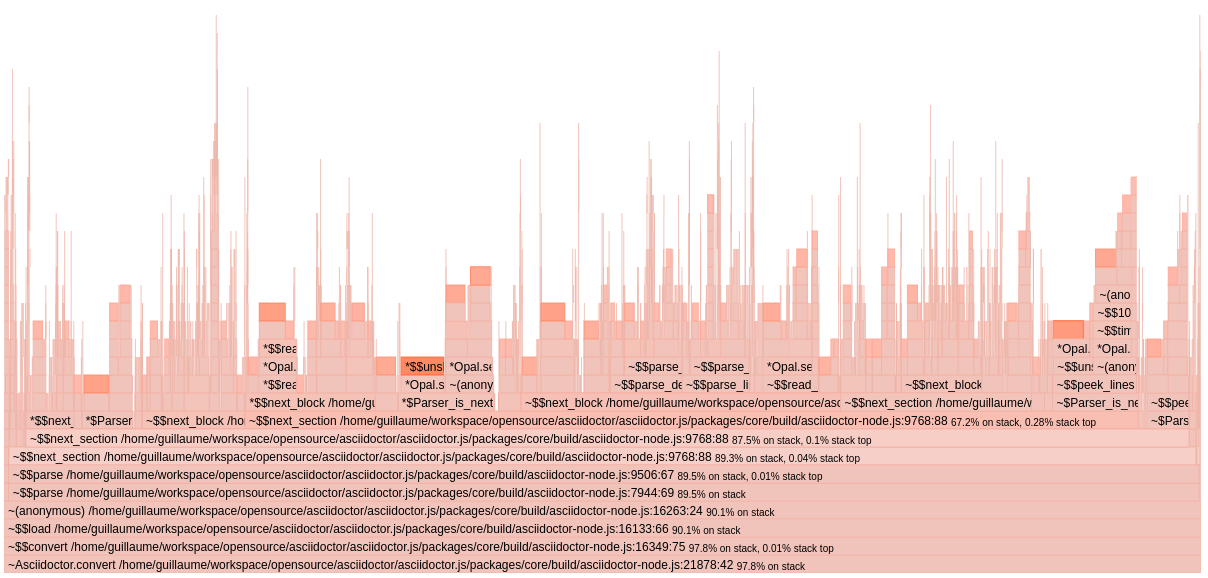
Here are the flamegraphs:


Can you find the culprit?
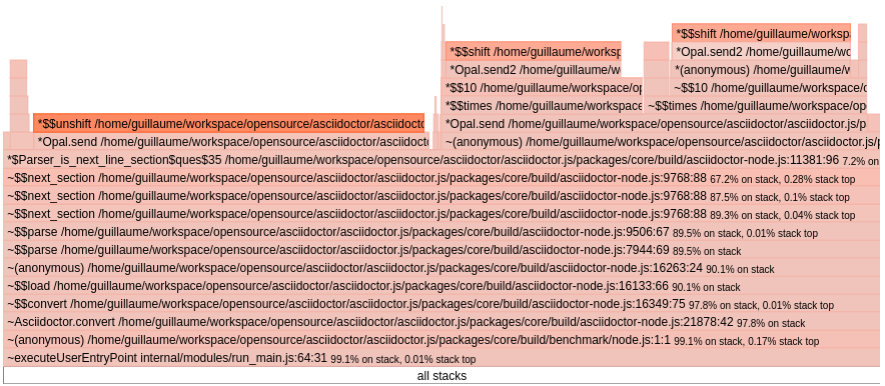
I can give you a clue. Take a close look at the dark orange blocks.
Can you zoom and enhance that? 🔍
Sure I can!

As you can see, unshift and shift are almost always on the top of the stack.
Let’s dig a bit further… 🕵️
As you might know, Asciidoctor.js is transpiled from Ruby to JavaScript using Opal.
As a result, the unshift and shift are actually Ruby methods implemented in JavaScript:
The implementation in Opal is actually pretty straightforward and delegates most of the work to Array.prototype.splice, Array.prototype.shift and Array.prototype.unshift.
So how comes that these functions are way slower in Node 12? 🤔
Micro-benchmark
Let’s write a micro-benchmark to compare the performance of Array.prototype.splice on Node 10 and Node 12.
In the following example, I’m using the excellent Benchmark.js:
const Benchmark = require('benchmark')

const bench = new Benchmark('splice', () => {
  ['1', '2', '3', '4', '5', '6', '7', '8', '9', '10'].splice(0, 1)
})
console.log(bench.run().toString())splice x 7,555,366 ops/sec ±3.04% (94 runs sampled)
splice x 20,305,330 ops/sec ±0.71% (93 runs sampled)
You read it right, Array.prototype.splice is approximately 2.5x times faster on Node 12 (not slower!). 😕
While this result is counter-intuitive, it clearly indicates that Array.prototype.splice has been optimized between Node 10 and Node 12.
In other words, the implementation changed.
Now let’s try to run the same test when the Opal runtime is loaded.
splice x 7,504,100 ops/sec ±3.26% (90 runs sampled)
Nothing to report… the performance is similar to what we had before when Opal runtime was not loaded.
splice x 984,509 ops/sec ±0.41% (92 runs sampled)
Oh oh!
The code is now 20x times slower compared to Node 12.18.4 and 7x times slower compared to Node 10.22.1.
Instinctively, it seems that when Opal runtime is loaded we are not benefiting from a performance optimization in V8… As a result, I decided to document myself about the V8 engine and found a couple of really well written articles by Mathias Bynens.
In one of them, "JavaScript engine fundamentals: optimizing prototypes", we can read:
Based on this knowledge, we identified a practical JavaScript coding tip that can help boost performance: don’t mess with prototypes (or if you really, really need to, then at least do it before other code runs).
All of a sudden, I connected the dots! 💡
Opal relies on prototypes to augment built-in objects and implement Ruby inheritance model.
In fact, Opal will actually replace the prototype on the Array built-in object using Object.setPrototypeOf.
I was now able to reproduce this issue adding a single line of code:
Object.setPrototypeOf(Array.prototype, {})Once Array.prototype has been altered, several Array operations are not benefiting anymore from the optimizations in V8.
V8 mailing list
Since I had a simple reproduction case, and a better idea of what was going on, I decided to post a question on the v8-users mailing list.
Ben Noordhuis kindly answered my question:
Array.p.splice()returns a new array.array-splice.tqhas a fast path for that (ExtractFastJSArray, defined in src/codegen/code-stub-assembler.cc) but that’s only sound whenArray.prototypeis unmodified, hence theIsPrototypeInitialArrayPrototype()check.
Older versions of V8 called out to this JS-with-extensions code: github.com/v8/v8/blob/7.0.1/src/js/array.js#L599-L642
For reference, Node 10.22 is using V8 version < 7.0 and Node 12.18 is using V8 version 7.8.
As pointed by Ben, the implementation changed, and now the fast path is only available when Array.prototype is pristine.
It all makes sense now, and I guess "don’t mess with prototypes" is pretty good advice! 😅
But unfortunately that’s not always possible. In our case, Asciidoctor.js relies on Opal and Opal relies on prototypes…
In his reply, Ben also suggested to "open-code" a faster version of Array.prototype.splice:
If
Array.p.splice()performance is vital to you, you can try open-coding it. I did something similar in Node.js a few years ago, to great effect: github.com/nodejs/node/commit/d3f8db124463e478420d8bba6fa5cf13af7b4ecb
In the next article, we will put Ben’s suggestion into practice! 🚀